
The Analytics overview shows how the connected accounts in a brand performed during a chosen period. Set the scope first, then use the cards and charts to answer a specific question, such as which platform received more activity this month.
Choose the reporting scope
Open the correct brand, then in the sidebar open Analytics and select Dashboards. Choose the dashboard or platform you want to inspect. The default dashboard combines the available connected-account data; a platform view narrows that context.
Open the range control, such as Last 30 days, and choose a preset or set From and To. Check Include Today and the time zone shown in the chooser. Today's figures can still change as activity arrives.
If you enable Compare To, choose the comparison period and whether to show Percentage change or Absolute change. Select Done. Read a change indicator as a comparison with that chosen period, not automatically as growth since the start of the account.
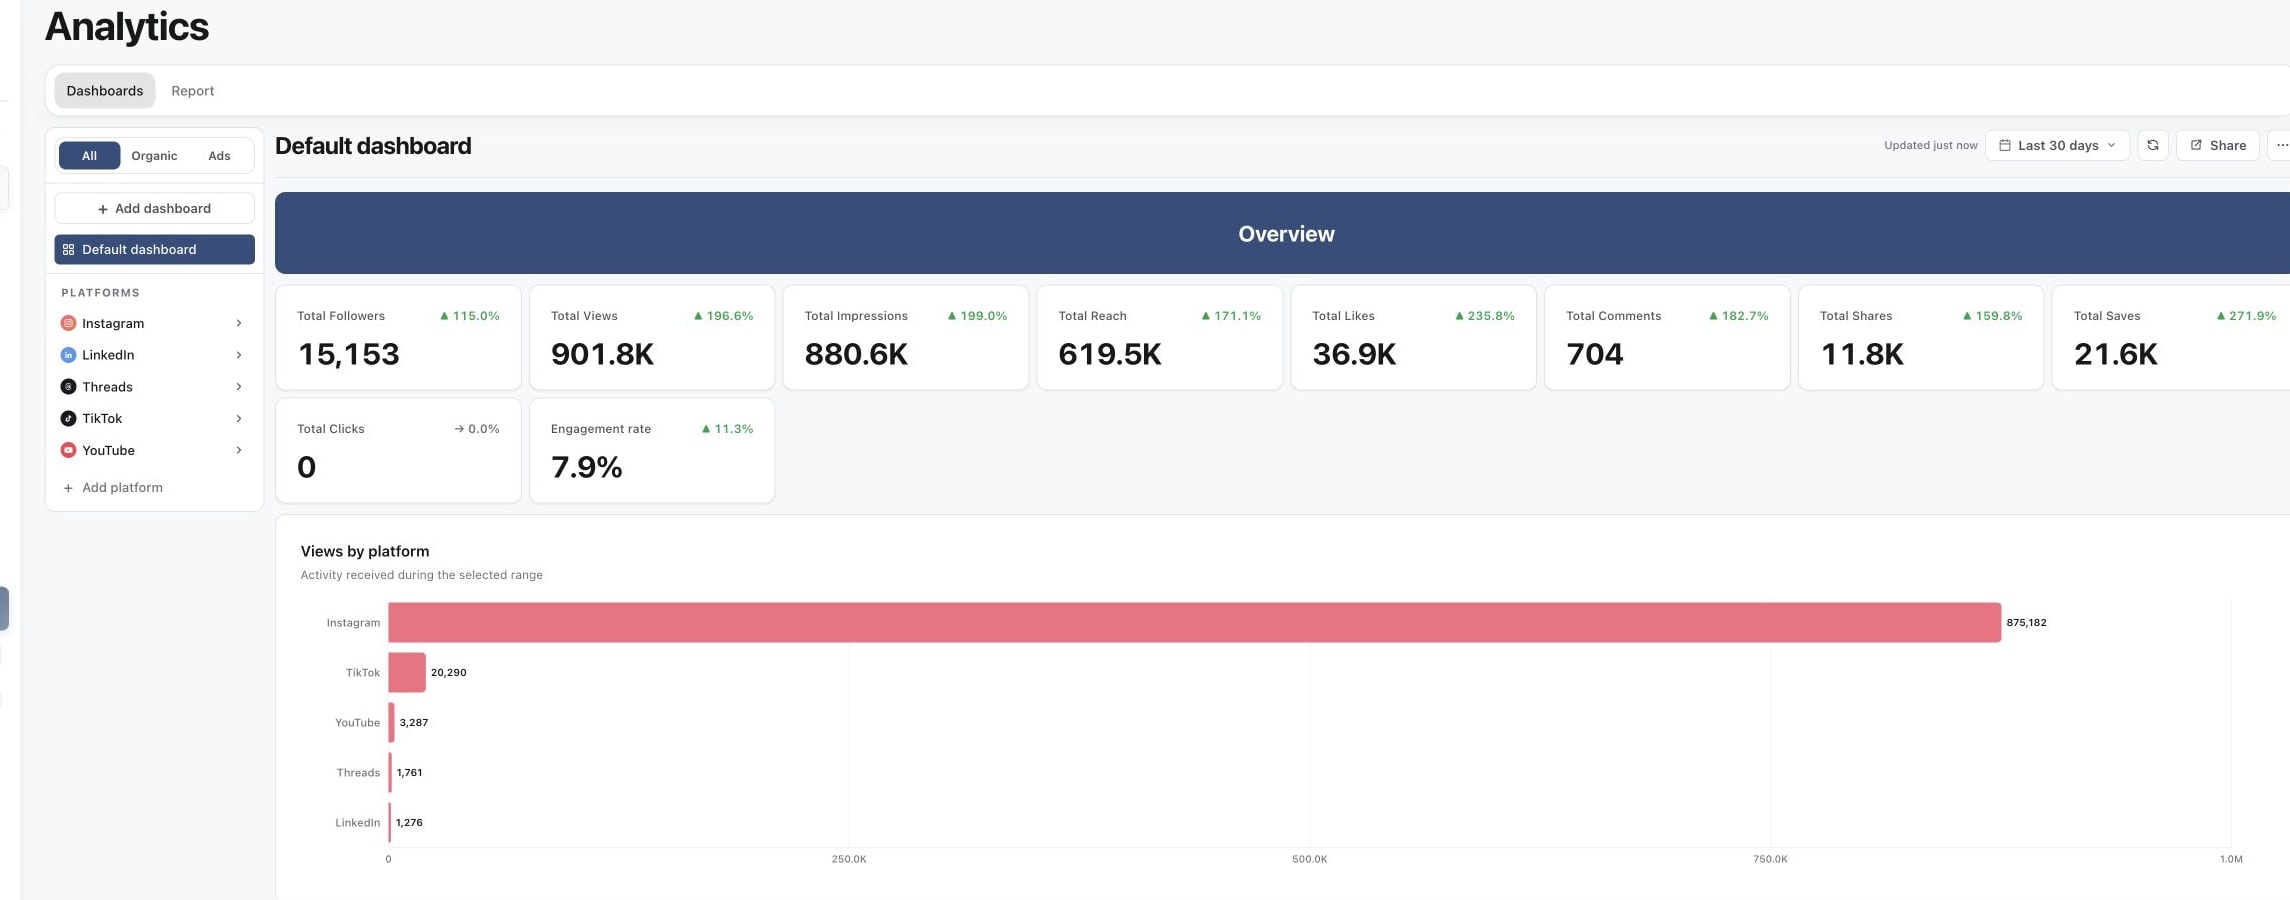
1. Start with the cross-platform overview
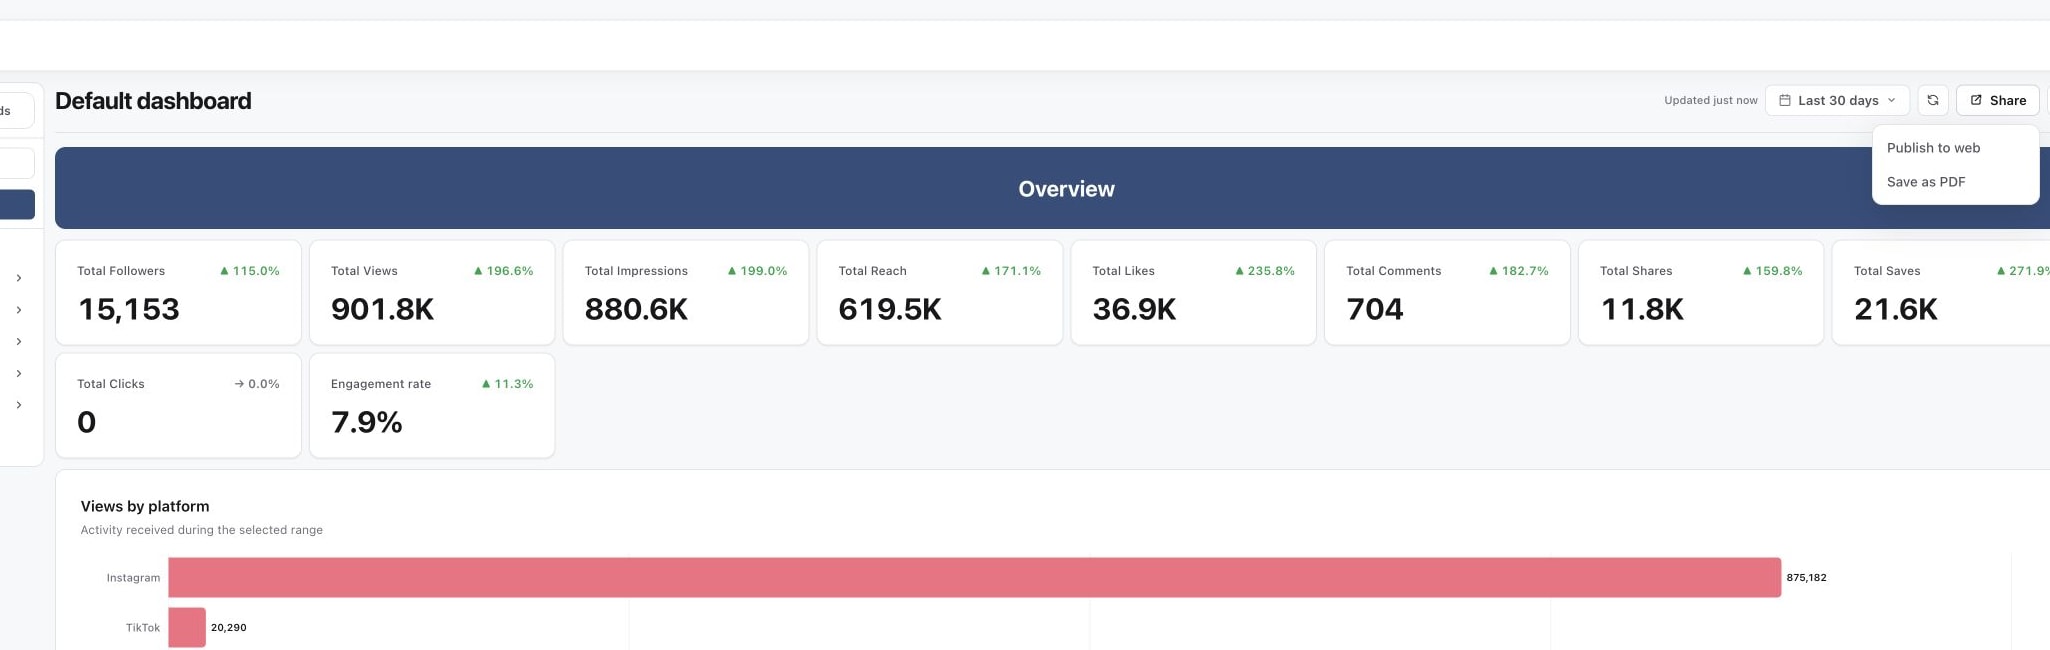
2. Refresh or export the same reporting period
Read the headline cards
| Measure | What it helps you understand |
|---|---|
| Total Followers | Audience size, with the available follower data and selected comparison. |
| Total Views, Impressions and Reach | Different measures of exposure. Keep their labels separate when reporting. |
| Likes, Comments, Shares and Saves | The kinds of engagement returned by the connected platforms. |
| Clicks | Available click activity, subject to the platform's metric coverage. |
| Engagement rate | Engagement relative to views for the reported period, rather than simply the number of followers. |
The overview's engagement calculation uses likes, comments, shares and saves relative to period views. A platform's native rate may use another denominator, so compare definitions before comparing percentages.
Use the charts and post sections together
Views by platform measures activity received during the selected range. It can include activity on content published before that range. Daily views shows how that activity changes over time.
Use platform sections to locate the source of a change, then inspect Best posts or Posts performance for relevant content. Post-level lifetime figures should not be added together to reconstruct the account's period total. Publication counts and received activity describe different things.
Sections such as Best time to post, Posting frequency and Audience demographics depend on available data. Treat them as evidence to review alongside your content and audience, rather than a guarantee that one time or format will always perform best.
Check freshness before sharing a conclusion
Read the update or coverage message and use Refresh analytics when you need a fresh check. Missing or partial data should be explained in a report, not silently treated as zero.
If a number differs from the platform, follow Fix missing or different analytics to match the account, range, time zone and metric definition.
Was this page helpful?
Related articles
Need more help with this?