
Views, impressions, reach and engagement describe different parts of performance. Keep the metric name, platform and date range attached to every number so a comparison stays meaningful.
Read each metric on its own terms
| Metric | What Sequence reports |
|---|---|
| Views | Content views reported by the connected platform during the selected date range. |
| Impressions | Times content or a profile was shown on screen. One person can create more than one impression. |
| Reach | Estimated unique people or accounts that saw the content or profile. |
| Engagement | Likes, comments, shares and saves received as a percentage of views in the selected range. |
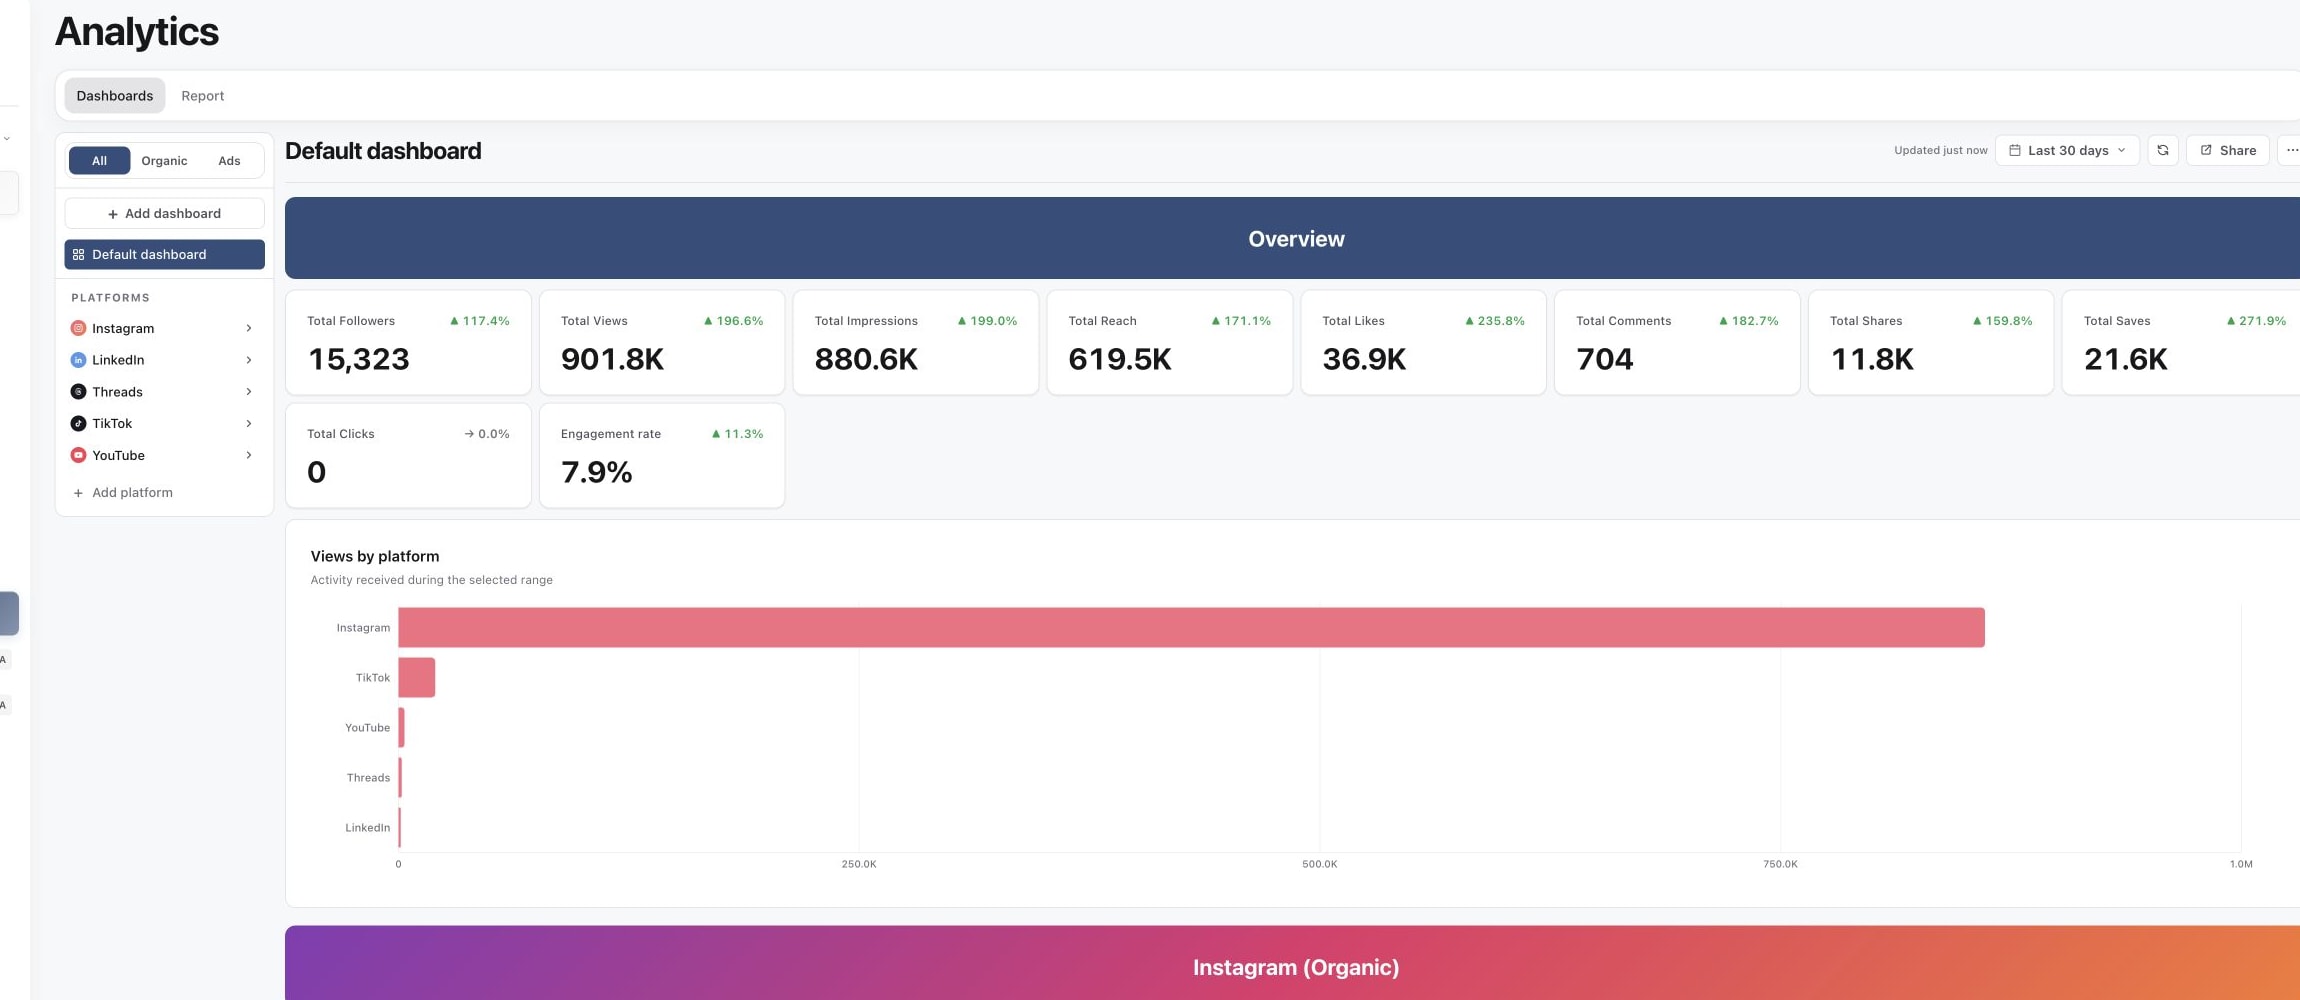
1. Read the cross-platform totals
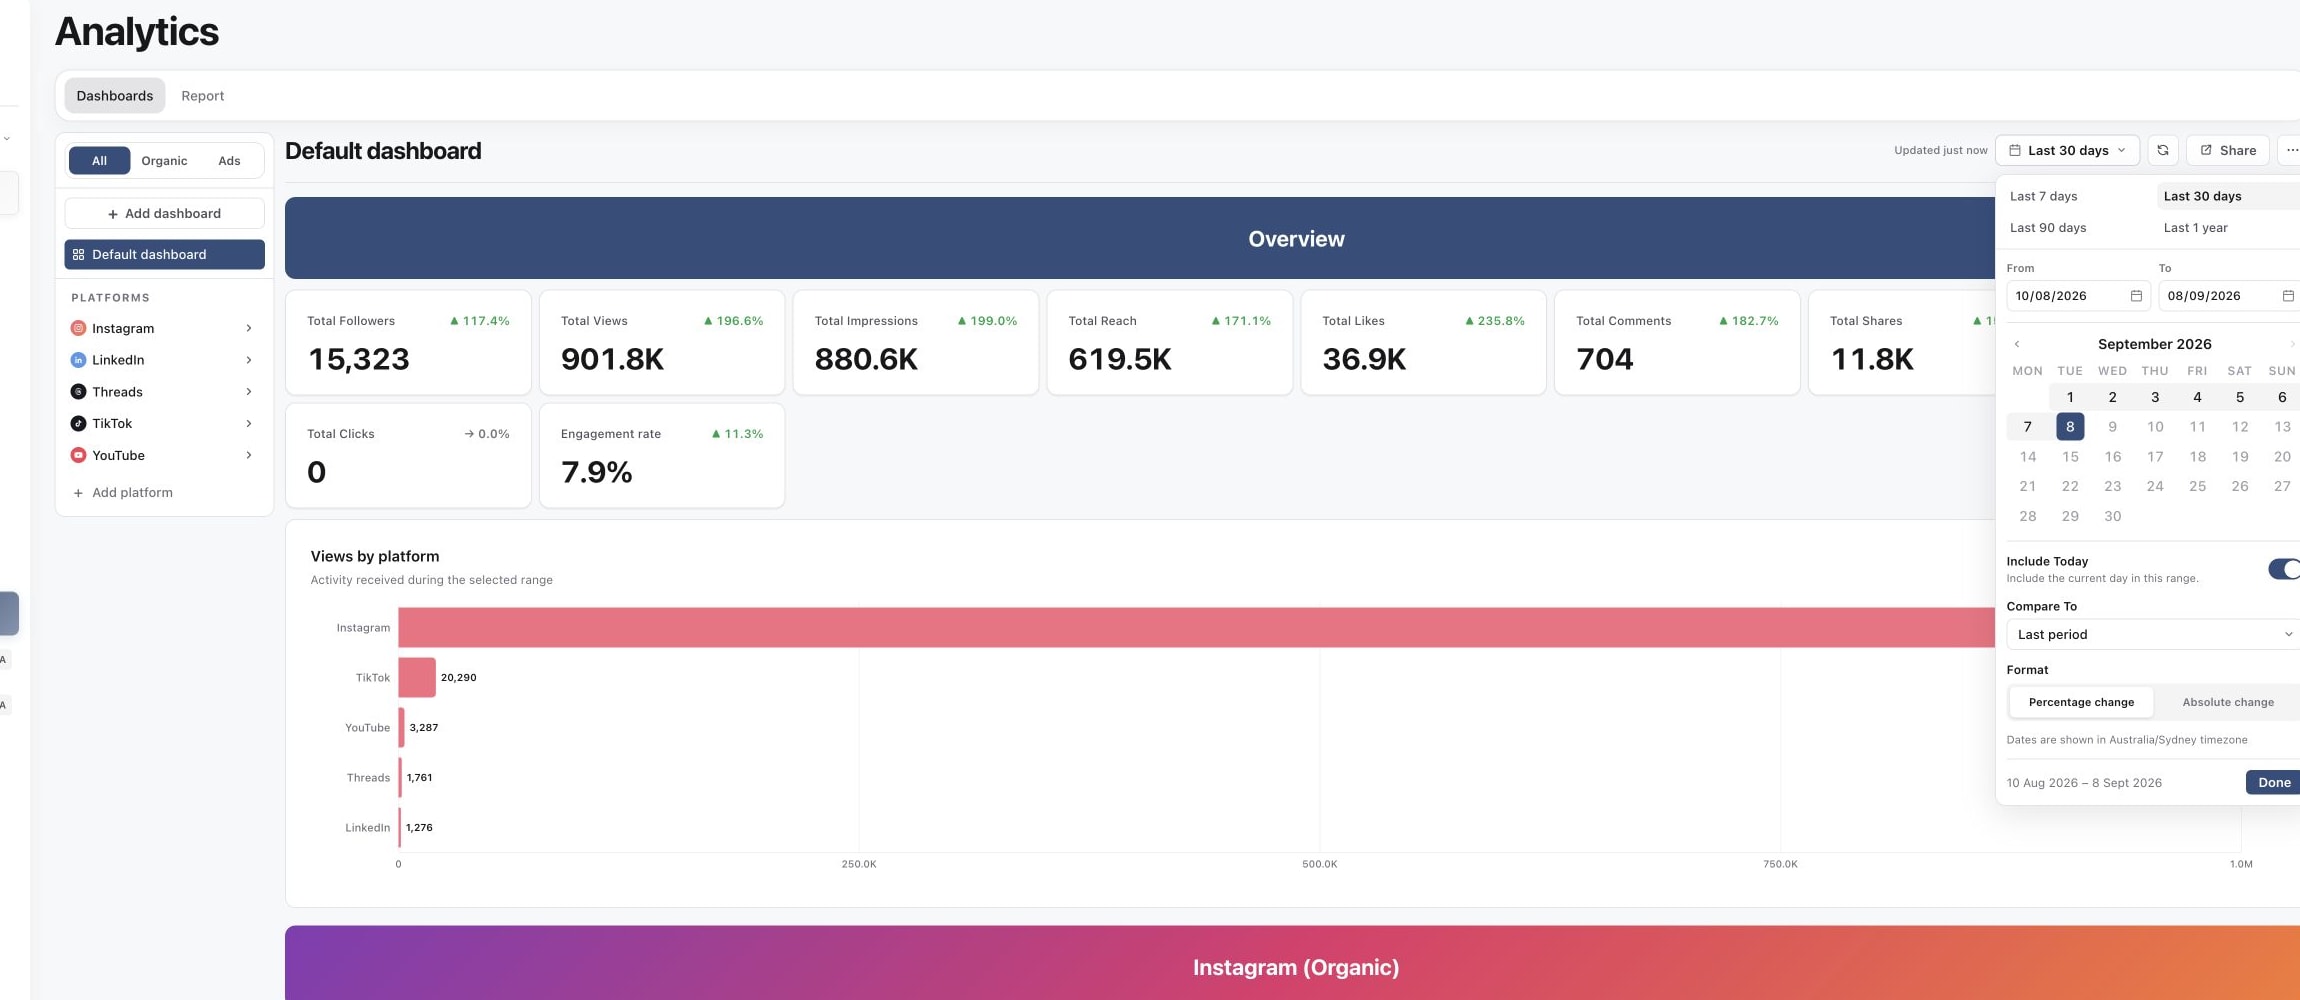
2. Check the reporting period
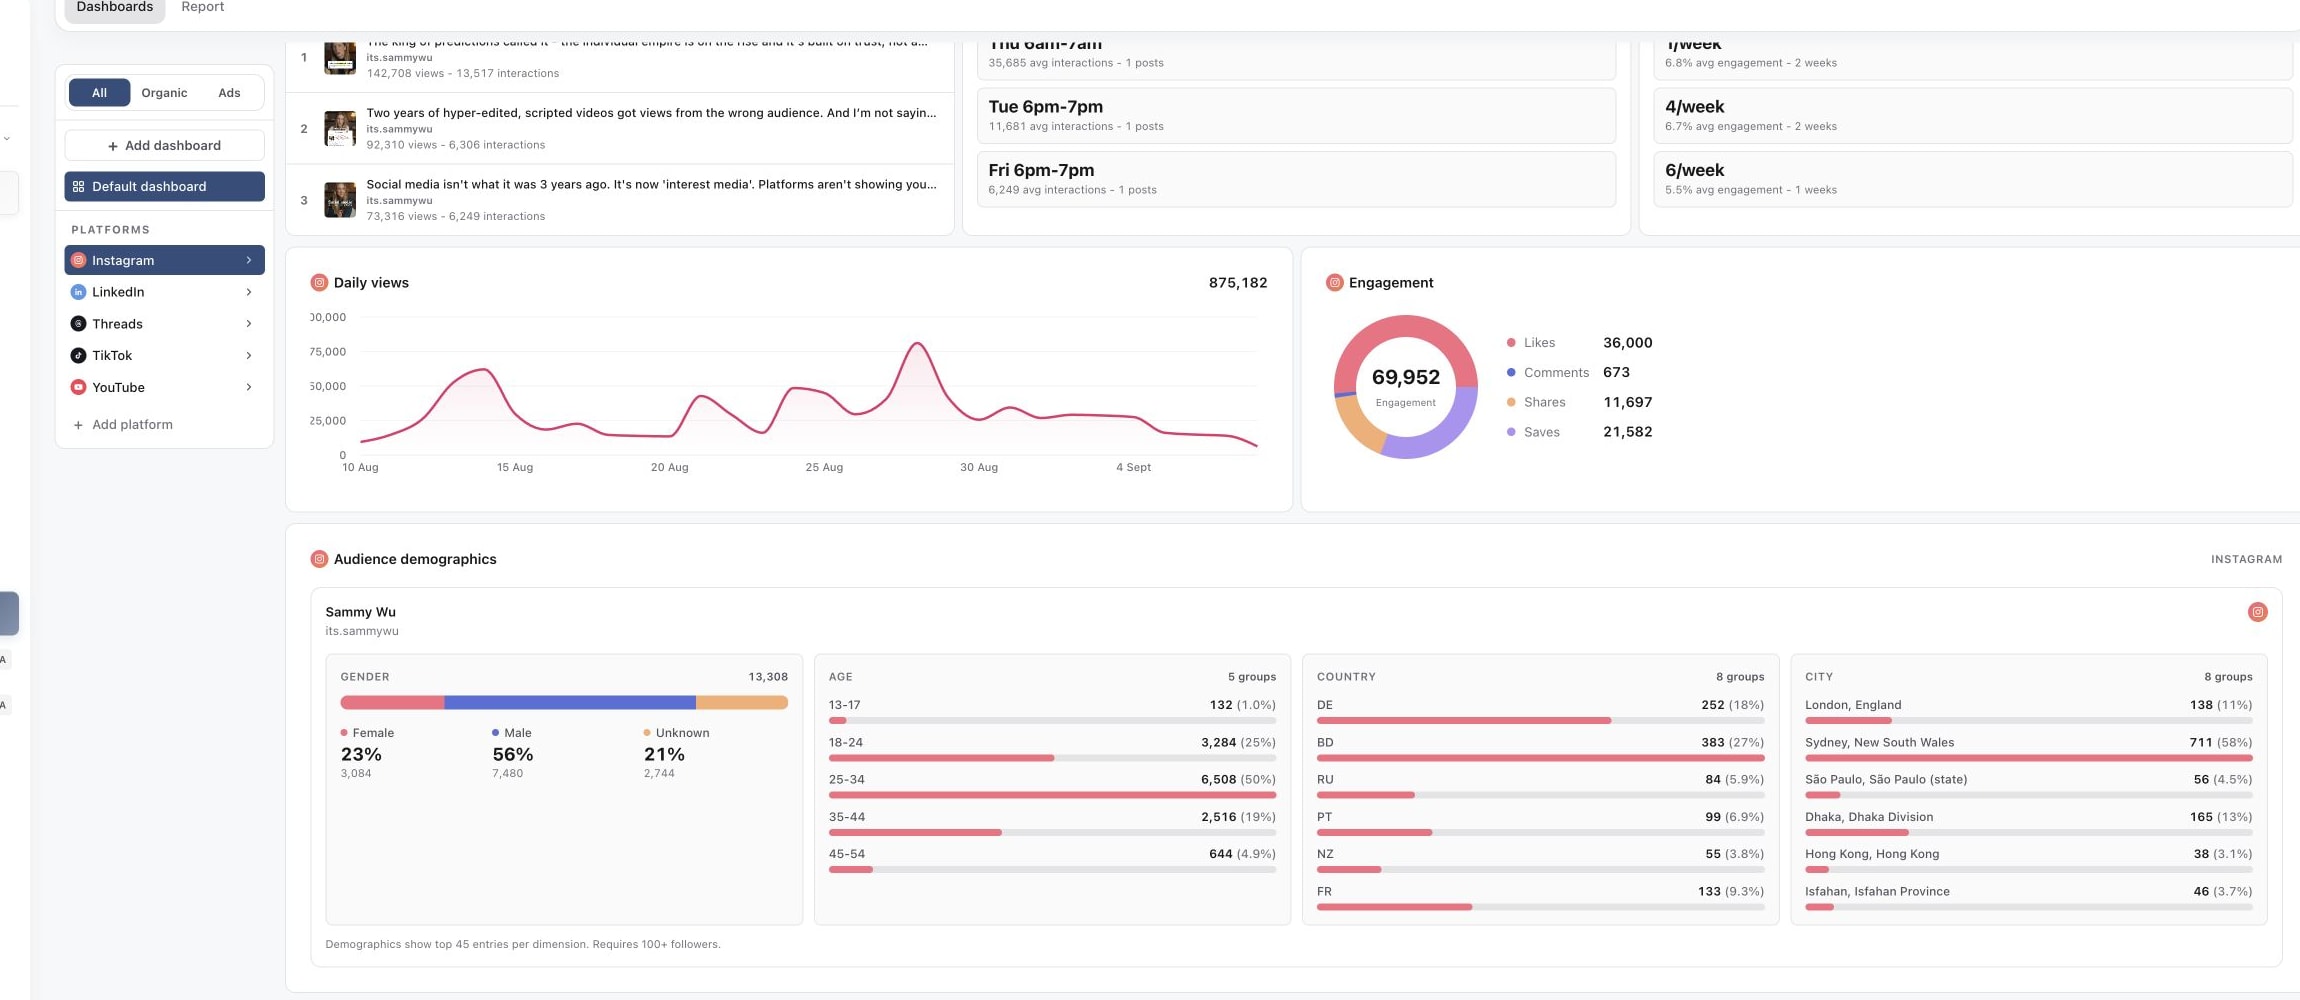
3. Connect totals to individual posts
Compare like with like
Choose one platform or the combined dashboard, set one reporting range and keep the same comparison period. A view on one platform may use a different threshold from a view on another, so treat a cross-platform total as a directional overview.
Use interaction counts to explain what happened after exposure. Shares and saves often indicate stronger intent than a passive view, while clicks show an action beyond viewing where the platform supplies that data.
Avoid common reporting mistakes
- Do not use impressions and reach as interchangeable labels.
- Do not compare a lifetime post total with an account total limited to a period.
- Do not treat missing or unsupported platform data as zero.
- Do not compare an engagement rate from Sequence with a native rate until the denominators match.
For the full dashboard workflow, see Read the Analytics overview.
Was this page helpful?
Related articles
Need more help with this?