
Useful performance comparisons hold the metric and scope constant. Start with a question, then use top content to explain the result instead of treating a ranking as the conclusion.
Set a fair comparison
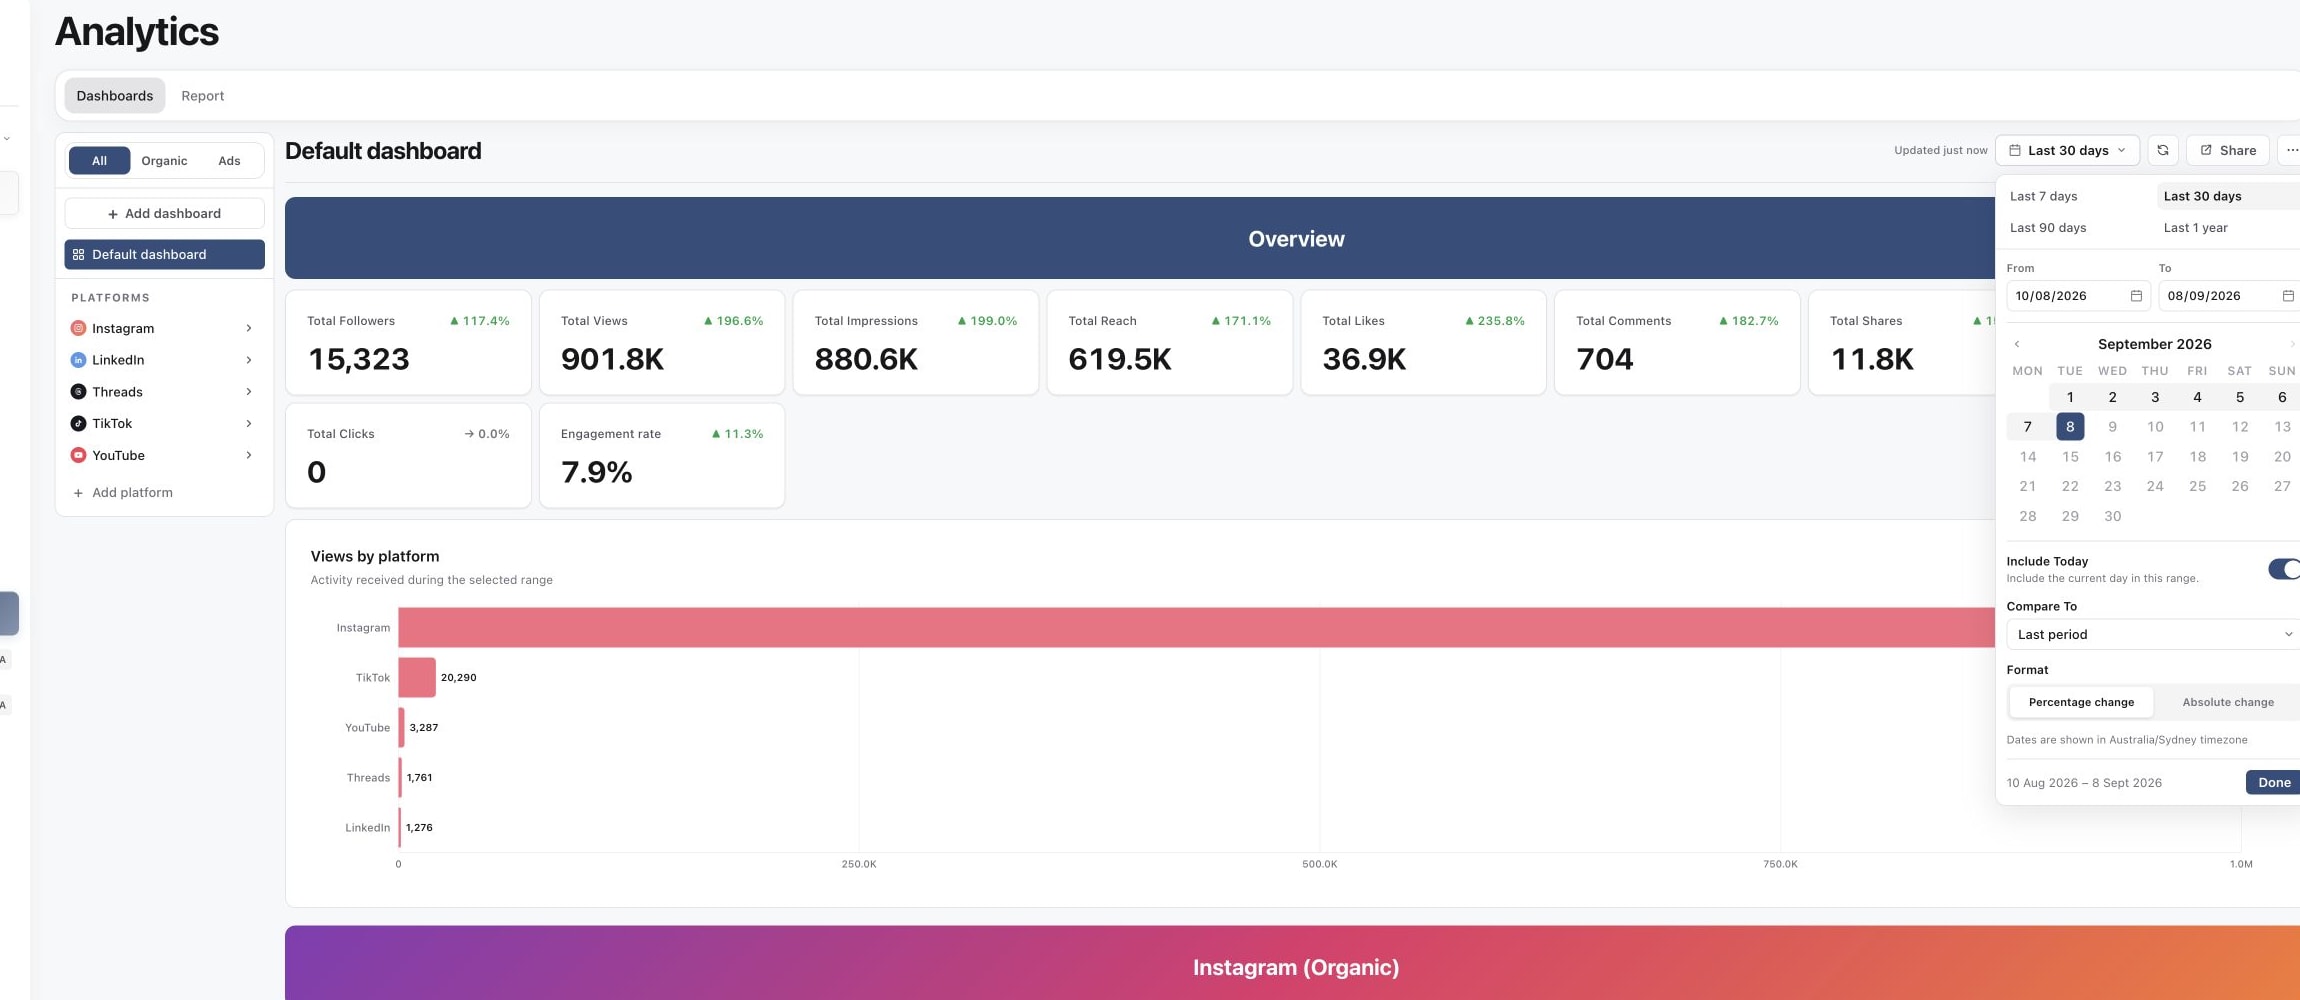
- 01Open Analytics in the correct brand.
- 02Choose the combined dashboard or one platform.
- 03Set the date range and, if needed, enable Compare To.
- 04Choose percentage or absolute change.
- 05Select one metric to compare across the same scope.
1. Start from the Analytics overview
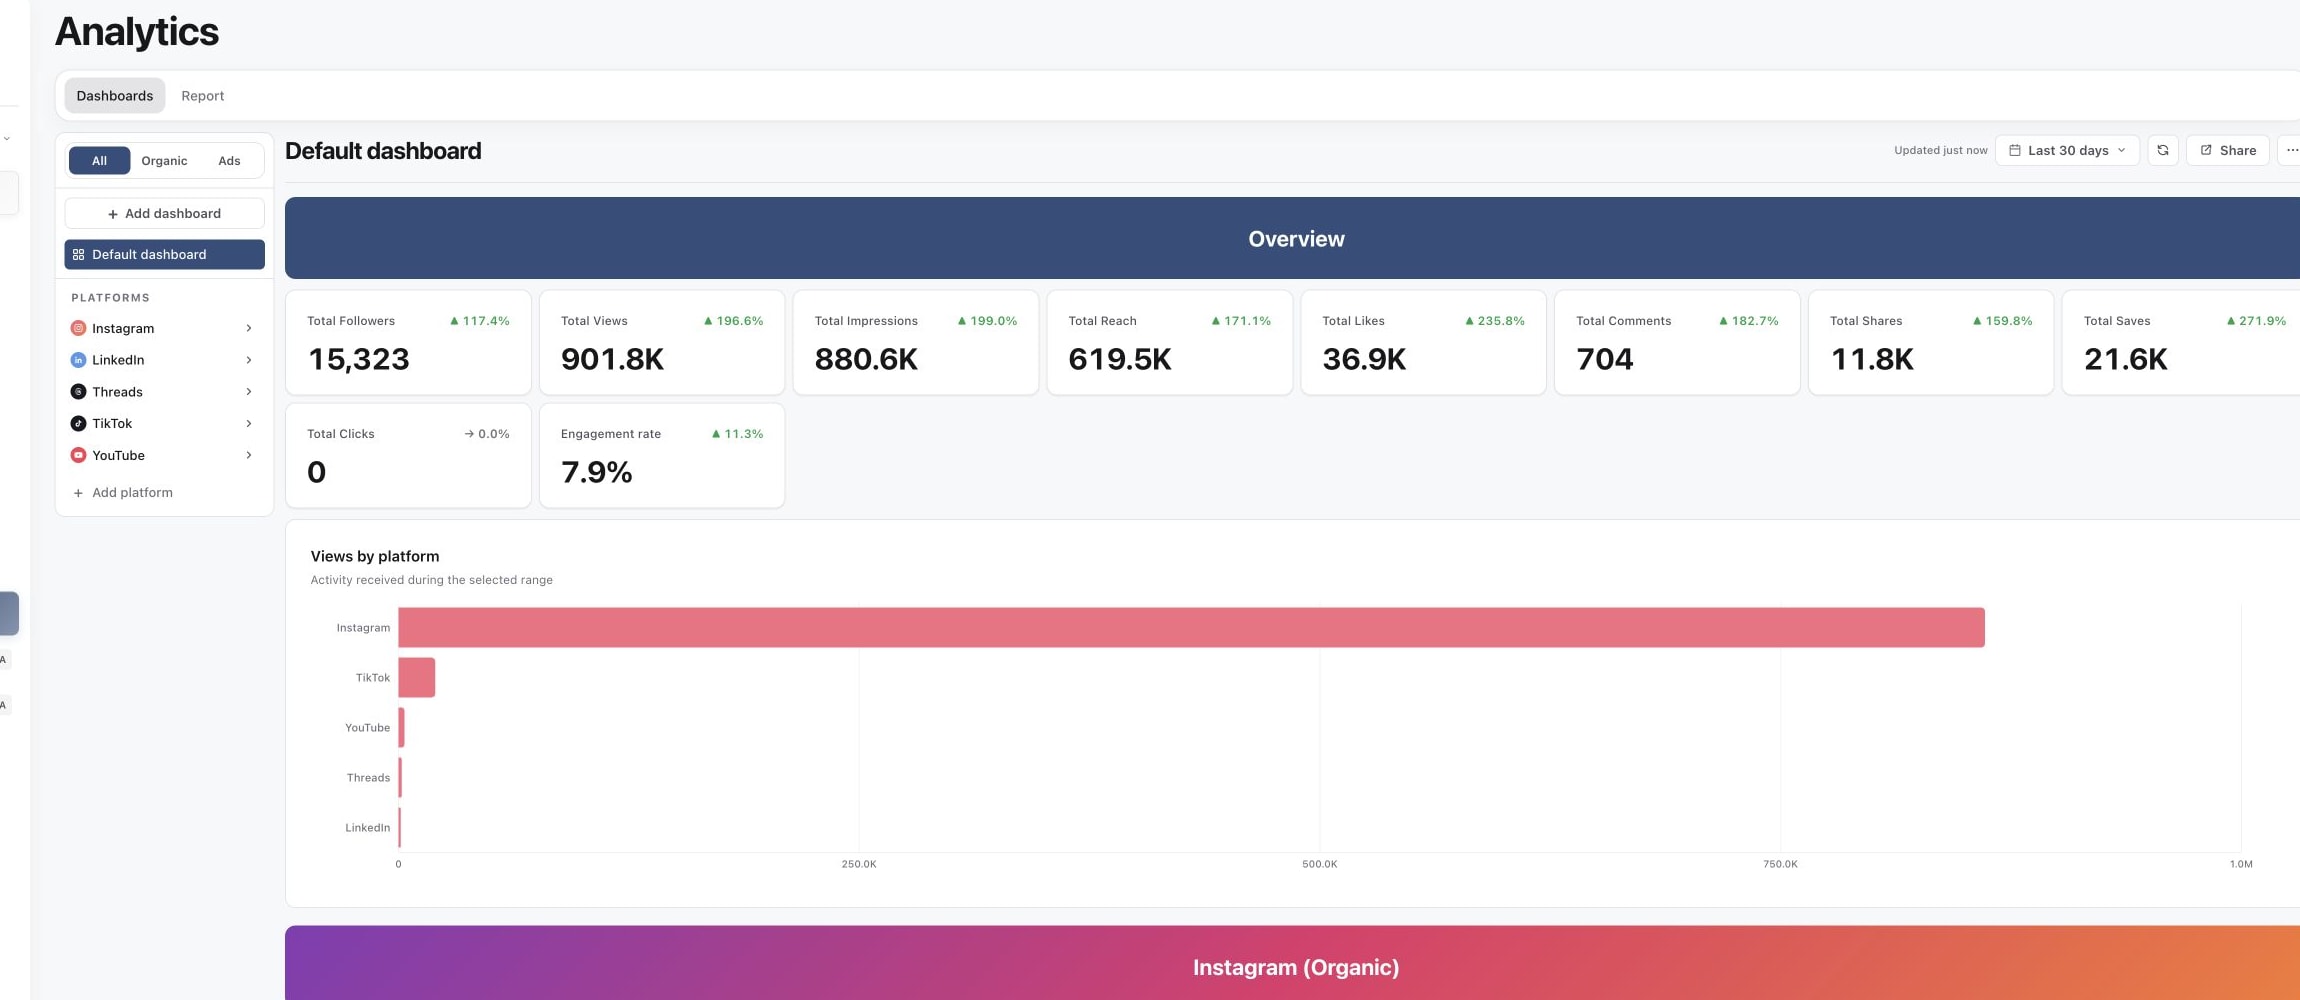
2. Set the comparison period
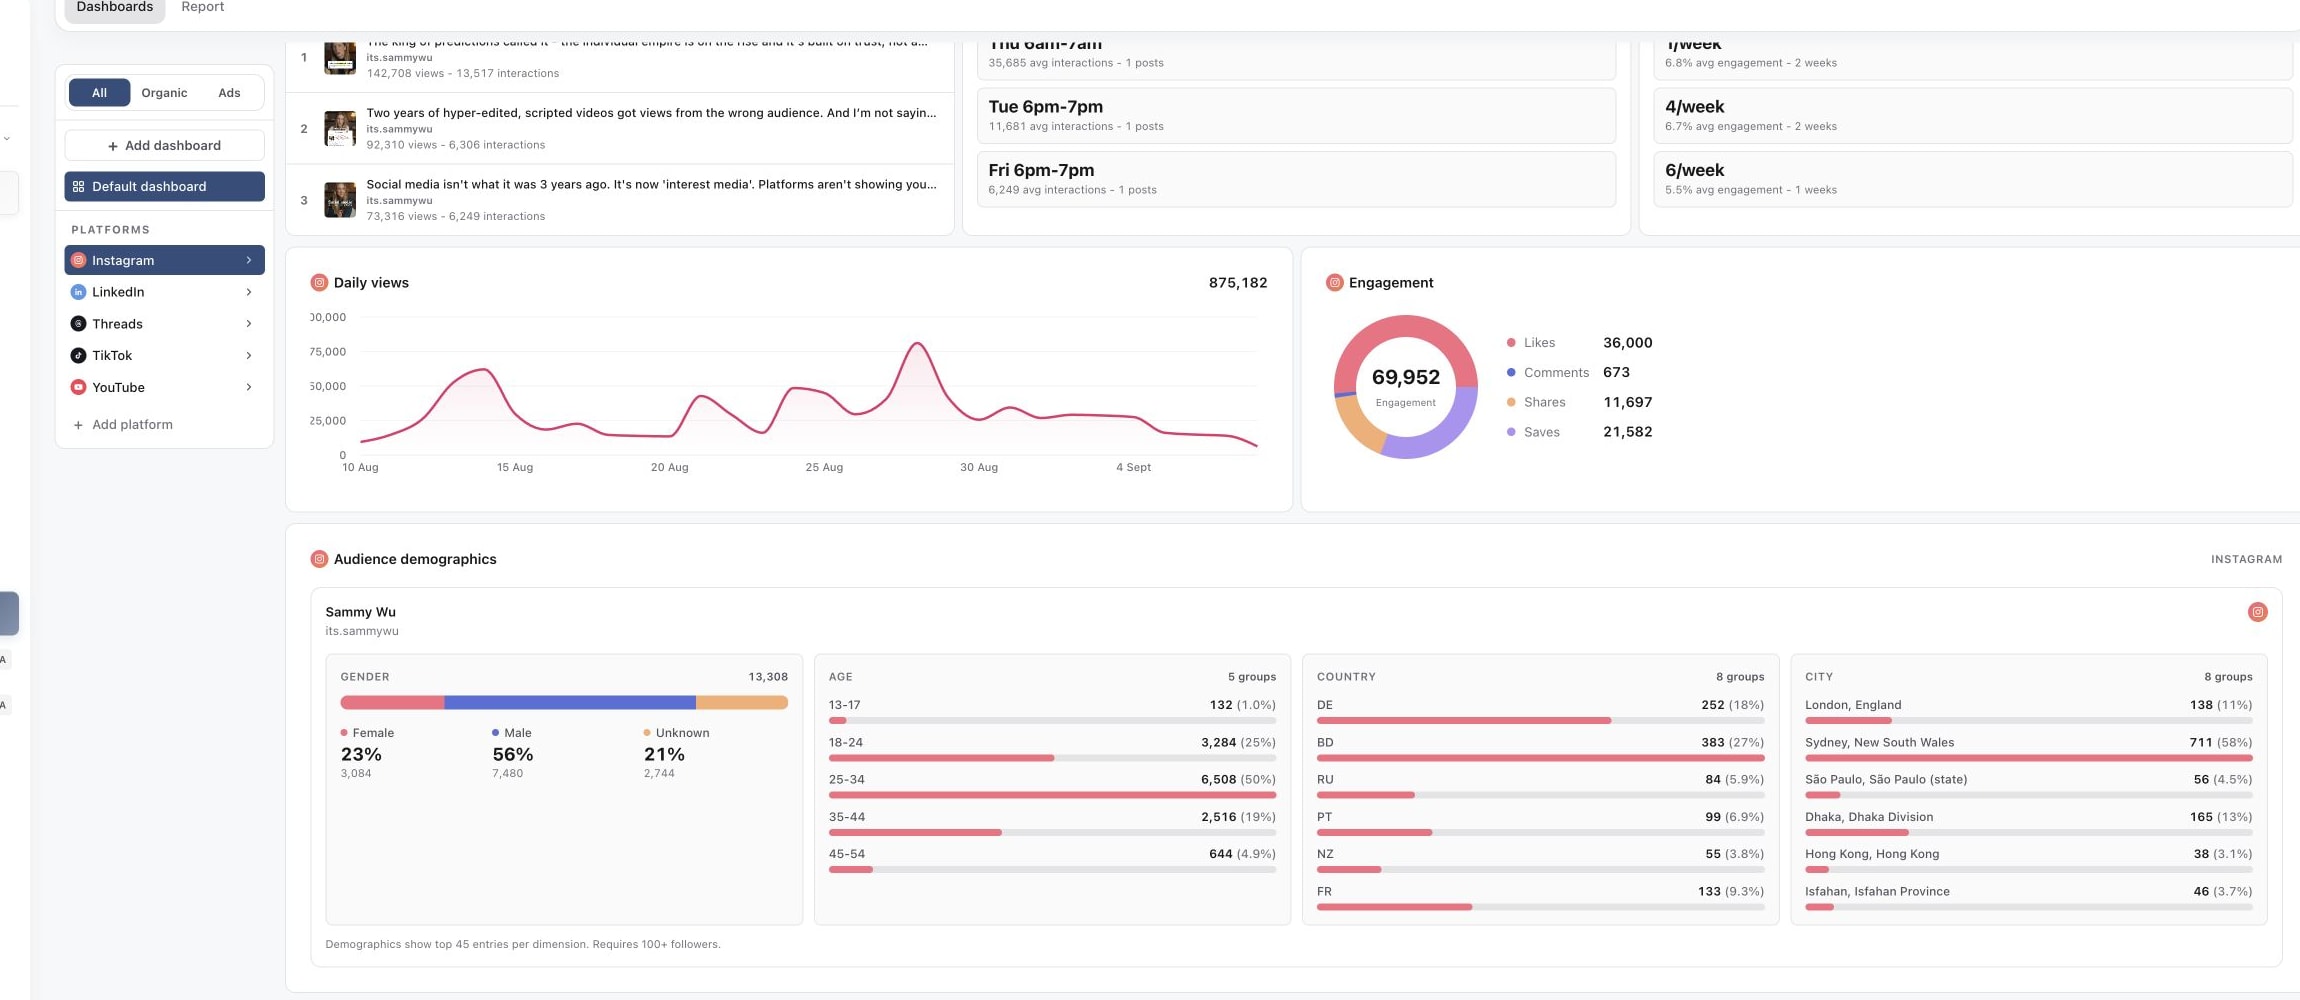
3. Review the best-performing content
Find the source of the change
Use Views by platform and daily charts to locate where and when activity changed. Then inspect Best posts or Posts performance for the content, format, hook and publication pattern associated with that period.
Separate period activity from lifetime post metrics. A post published earlier can receive views in the selected range, while its post card may show a lifetime result.
Turn comparison into a decision
Record the metric, range, platform and candidate explanation. Repeat or adapt the pattern in future content, then compare another consistent period. Treat unavailable platform fields as missing, not zero.
Was this page helpful?
Related articles
Need more help with this?